ADD CONTEXT TO TRENDS
Add and compare annotations
An annotation records a dated store event, such as a launch or promotion, so it appears alongside the data you are reading.
3 min readAdd an event
You can return to the Annotations page to edit or delete an event.
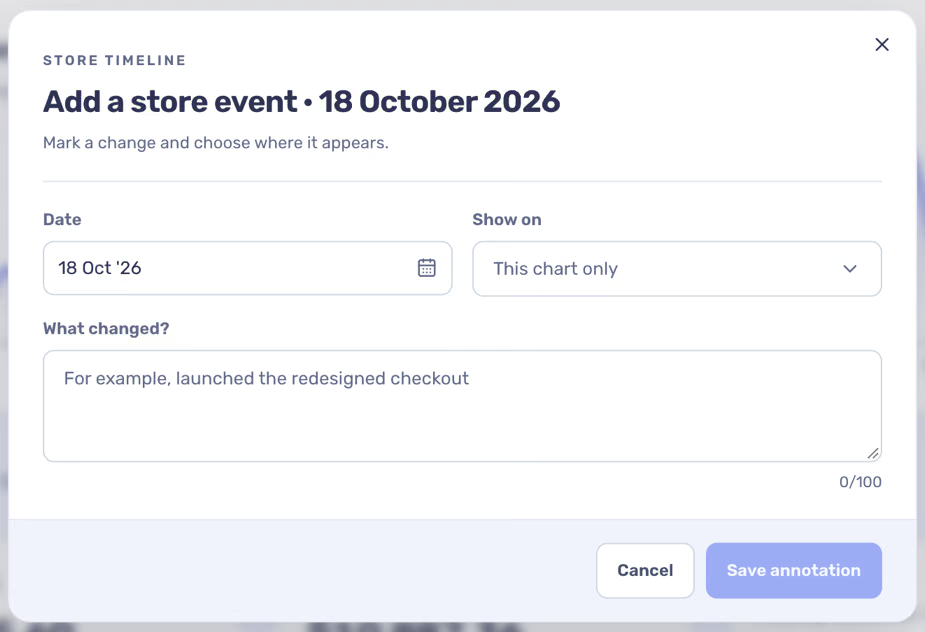
- Open Annotations and select Add annotation, or select a date marker on a supported chart.
- Choose the event date and write a short note.
- Choose whether it appears on all charts or only the selected chart, then save.
Compare what happened around it
The comparison is context, not proof that the event caused a change. Seasonality, other campaigns, and incomplete sync data can affect the result.
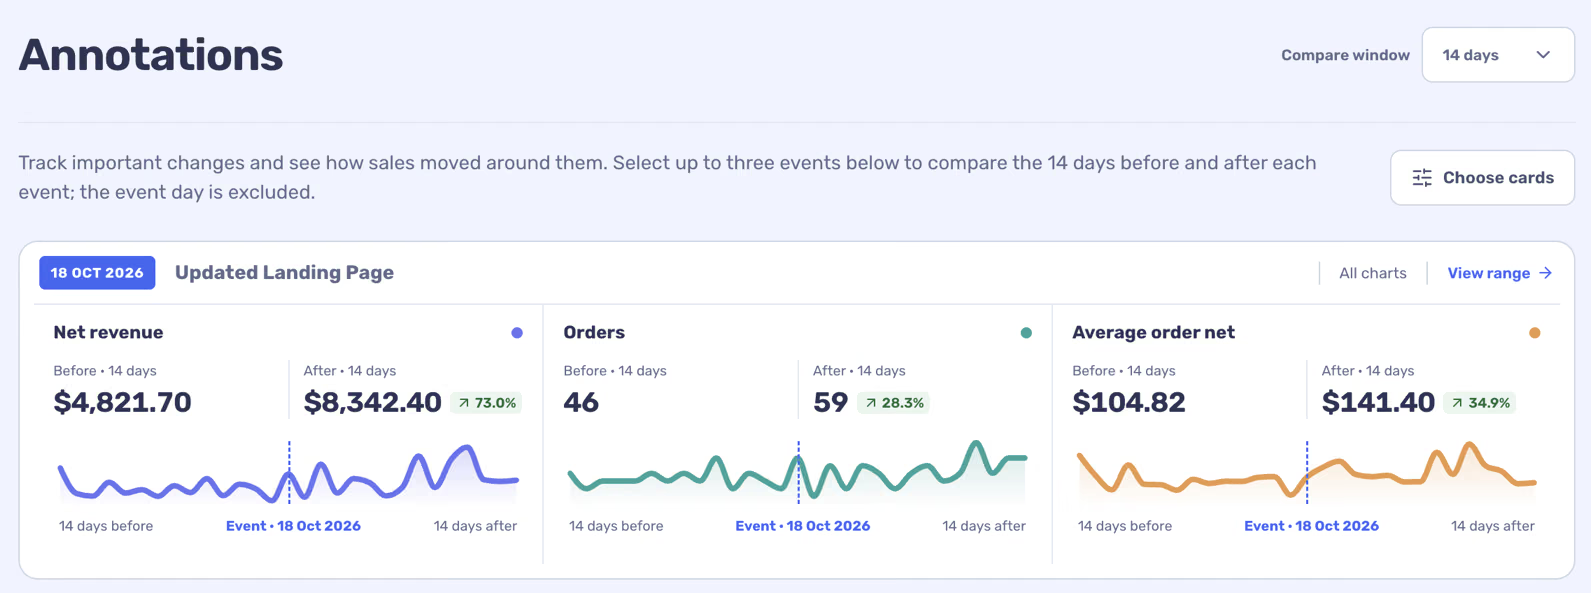
- In the event list, select up to three events.
- Review the before and after sales cards and charts for each event.
- Change the number of days around an event when you need a wider or narrower comparison.
Find annotations in reports
Supported charts mark annotated dates on their time axis. An event saved for all charts appears wherever that date and chart support it; a chart-specific event stays with that chart.