Understand your revenue
Use the Revenue report to see when revenue was received and how the components of your sales contribute to the total.
4 min readExplore revenue over time
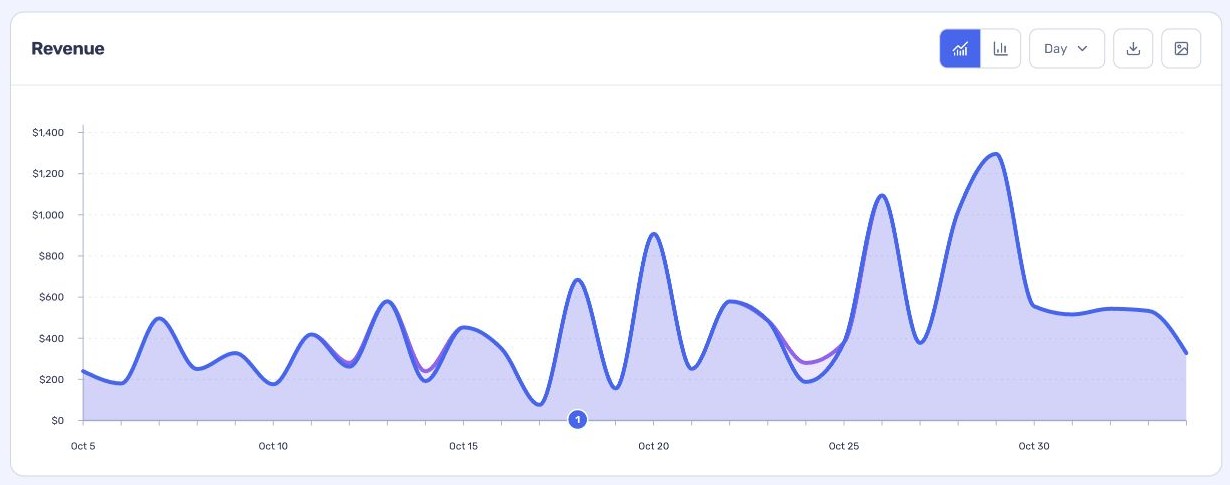
The chart lets you see patterns across the selected period. Use the Segment button when you want to focus the report on a particular set of orders.
- Open Reports → Revenue and choose a date range.
- Use the chart controls to switch the chart view or change its time grouping.
- Hover over the chart to inspect a point, and use the download controls when you want to save its data or an image.
Read the summary
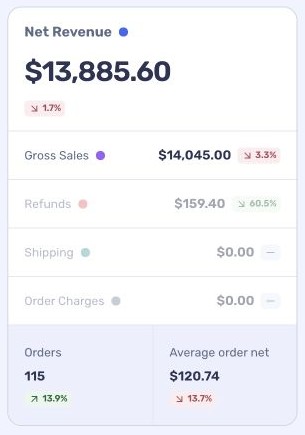
Net revenue is gross sales less taxes, shipping, order charges and refunds. The summary shows the components alongside orders and average order net. Comparison badges reflect the comparison period selected at the top of the report.
Select a metric with a coloured marker, such as Gross Sales or Refunds, to show or hide it on the chart. Select it again to restore it. A dimmed metric is hidden from the chart; its summary value remains visible. This changes the chart display, not the underlying totals.
Check your store’s reporting settings when a component or order is not included as expected.
Examine the breakdown
Revenue Breakdown lists the figures by the selected time grouping. Change the grouping or use Columns to choose what to show, and select a column heading to sort the table. Use the download control to take the breakdown with you.