Understand net profit
The Net Profit report shows what remains of net revenue after recorded costs, helping you look beyond sales alone.
4 min readExplore profit over time
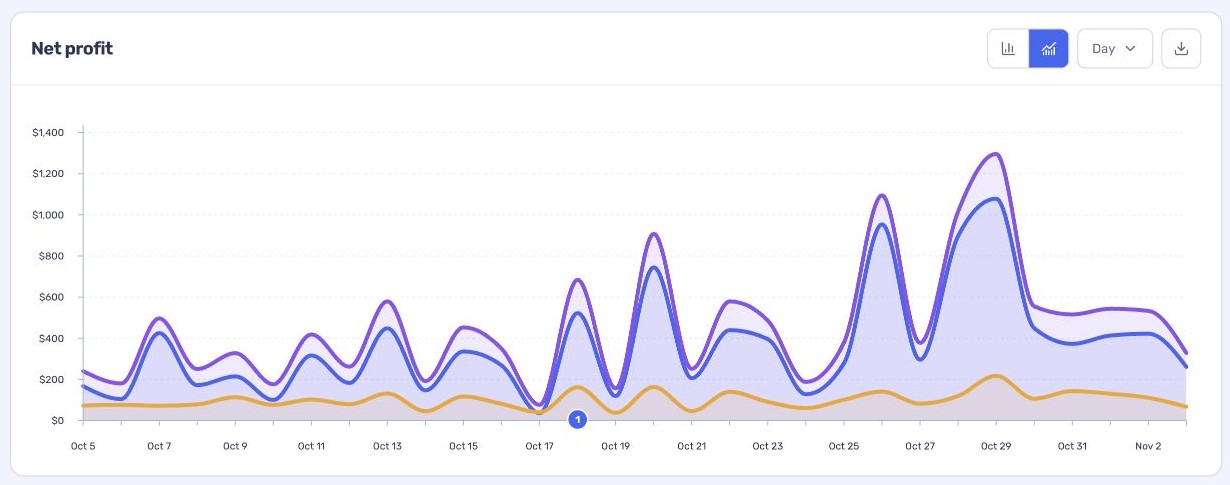
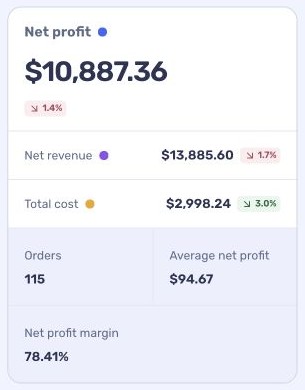
The chart shows net profit alongside net revenue and total recorded cost. The summary shows net profit, margin and average profit per order for the selected period.
Select Net profit, Net revenue or Total cost in the summary to show or hide its coloured series on the chart. Select it again to restore it; the totals do not change.
- Open Reports → Net Profit and choose a date range.
- Use Segment if you need to focus on particular orders.
- Switch the chart view or time grouping and hover over a point to inspect its values.
Review the costs behind profit
The Total cost section separates product, shipping, transaction, additional order, external, advertising and operational costs. Select Manage costs to review the rules and expenses you have configured.
Profit is only as complete as the costs available to Statnav. Check missing costs and report notices before using the figure for a decision.
Investigate the breakdown
Net profit by date lists orders, net revenue, cost, profit and margin by period. Change the grouping, choose columns or download the breakdown. When segmenting, advertising and operational expenses are shared costs and cannot be allocated to individual orders; the report offers a separate option to include them.