Understand customer reporting
The Customers report starts with customers who first ordered in the selected period, then shows what those customers went on to do.
4 min readExplore new customers
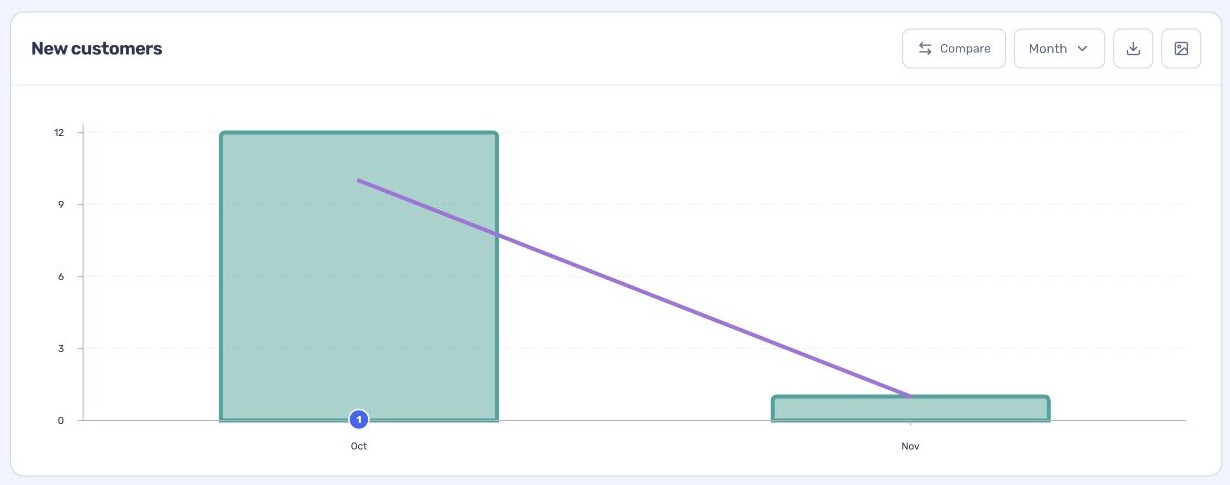
The report follows customers who first ordered in the selected period and includes their subsequent orders over their lifetime. View customers in this report opens the corresponding customer list.
Select New customers or Orders in the summary to show or hide its series on the chart. Select it again to restore it; the summary values do not change.
- Open Reports → Customers and choose the first-order date range.
- Use Segment to focus on a customer group if needed.
- Change the chart grouping to explore new customers over time.
Read lifetime value and orders
The summary shows the group’s subsequent orders and spend, as well as averages such as lifetime value, order value and lifetime orders. The first-ordered-month table groups customers by their first purchase so you can compare groups.
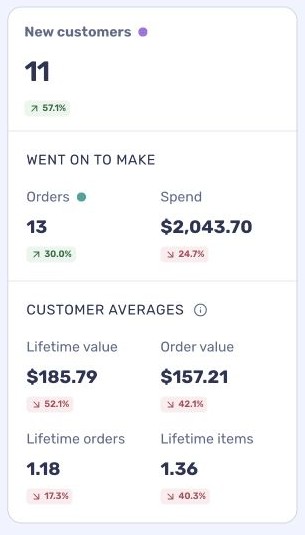
Recent groups have had less time to place repeat orders, so compare groups of similar age where possible.
Explore further
Use the customer map and other breakdowns to explore the group. For repeat purchasing and retention, open the separate Customer Retention report.