Understand your forecast
The Forecast report projects a historical trend forward for gross sales, orders, and new customers. It is a planning view, not a promise of future results.
4 min readChoose the history and future period
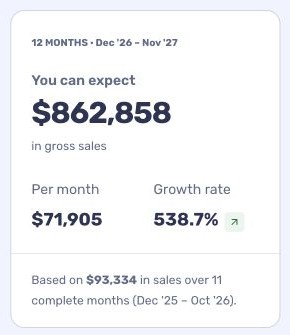
Statnav uses completed calendar months in the selected historical window. If fewer completed months are available, the report tells you.
- Open Reports → Forecast.
- Use Based on last to select 3, 6, 12, 24, or 36 completed months.
- Use Forecast to choose a future period, such as Next 30 days or Next 12 months.
Read the forecast
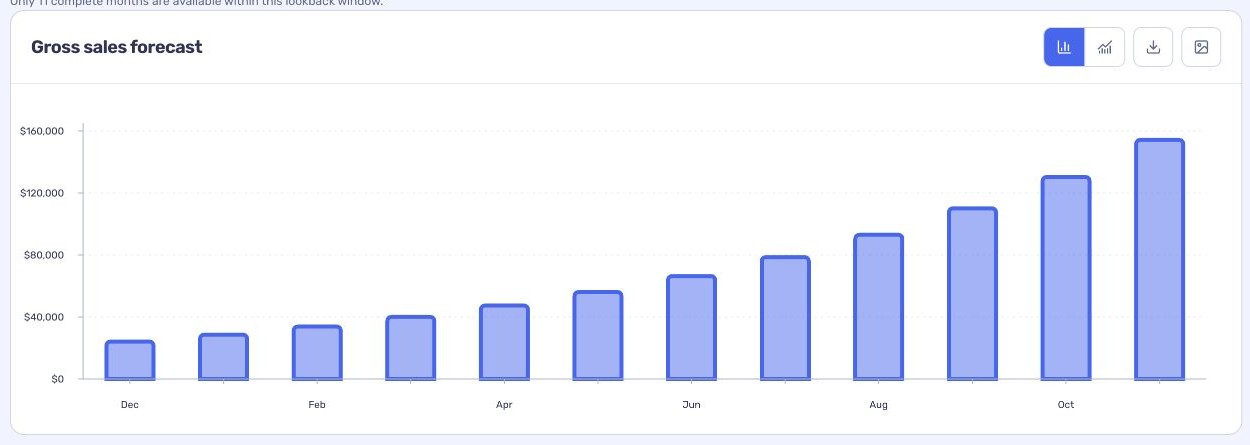
The report shows separate forecasts for gross sales, orders, and new customers. Each chart has a summary for its projected period. The growth rate compares the last forecast month with the first.
- Switch a chart between bar and line views.
- Download a chart image or its CSV data from its controls.
- Use About report for the calculation notes shown in the app.
Understand its limits
The projection extends a fitted monthly trend. It does not model seasonality, promotions, stock changes, or other future events. A short or unusual history can make a forecast less useful.
Try a longer historical window and compare it with your own business plans before making decisions.