Understand order reporting
The Orders report brings sales, order counts and customer purchasing patterns together for a selected period.
4 min readExplore orders over time
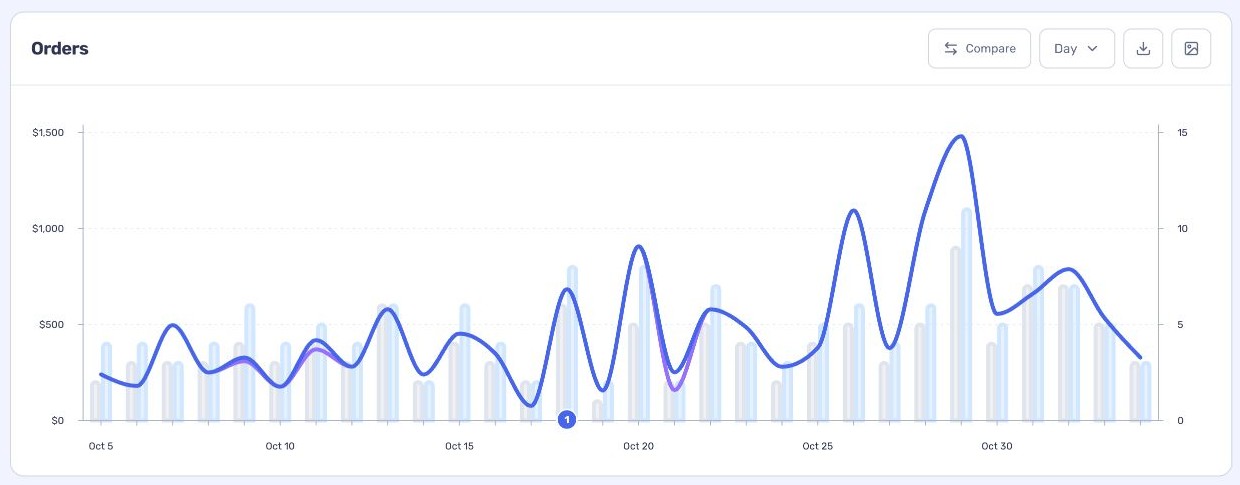
The chart and summary show sales and order activity for the selected period. Use View orders in this report to inspect the underlying orders.
Select a summary metric with a coloured marker to show or hide it on the chart. Select it again to restore it; this does not change the totals.
- Open Reports → Orders and choose a date range.
- Use Segment to focus on a group of orders, if needed.
- Change the chart grouping or use Compare to adjust the chart comparison.
Read averages and customer mix
Order averages provide context for sales, orders and items per month or per order. The New vs. returning customers section compares the two groups and their contributions to orders and sales.
Averages can move when either order values or the mix of customers changes; compare them with the counts as well.
Take the results with you
Use the chart or table download controls to export available data. The report’s Export as PDF button creates a shareable report. Check your date range and segment before exporting.