Understand refund reporting
The Refunds report helps you see the value and frequency of refunds, and how long customers wait for them.
4 min readChoose how to view refunds
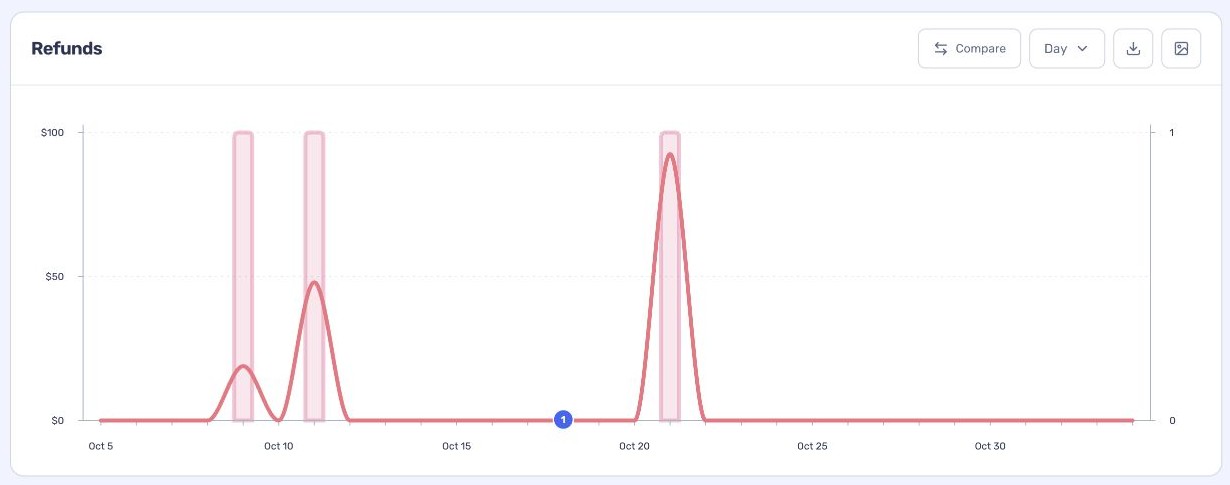
The chart shows refunds over the selected period. The summary provides the refunded amount, refund rate, average refund and other measures, with comparison values where available.
Select a summary metric with a coloured marker to show or hide it on the chart. Select it again to restore it; the totals remain unchanged.
- Open Reports → Refunds and select the reporting period.
- Choose By Order Date or By Refund Date to change how refunds are grouped in time.
- Use Segment when you need to narrow the orders included in the report.
Review time to refund
Time to refund groups refunds by the time between the order and refund. Use the distribution and median to spot whether refunds are generally quick or whether some take longer.
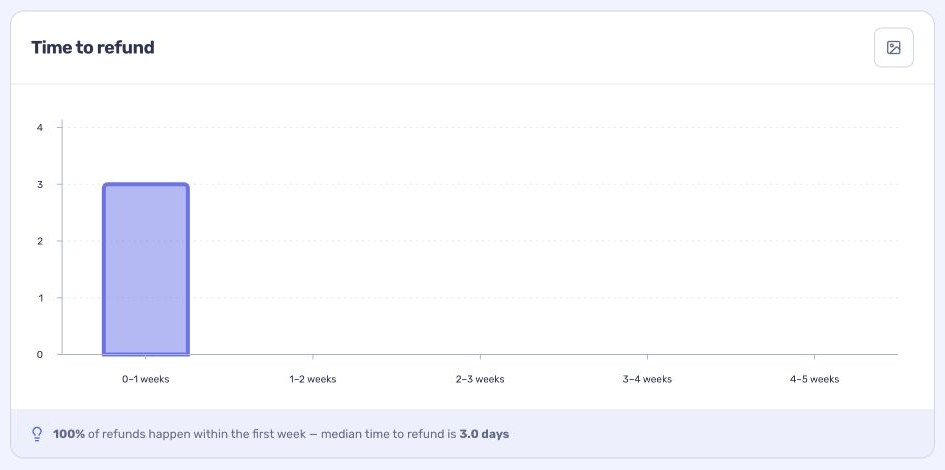
The timing view only reflects the refund records available in the connected store.
Investigate the detail
Review the product and grouped breakdowns further down the report, and use View refunds in this report to inspect individual records. A cash refund without recorded product lines may not appear in a product breakdown.