EXPLORE YOUR STORE DATA
Compare segments and products
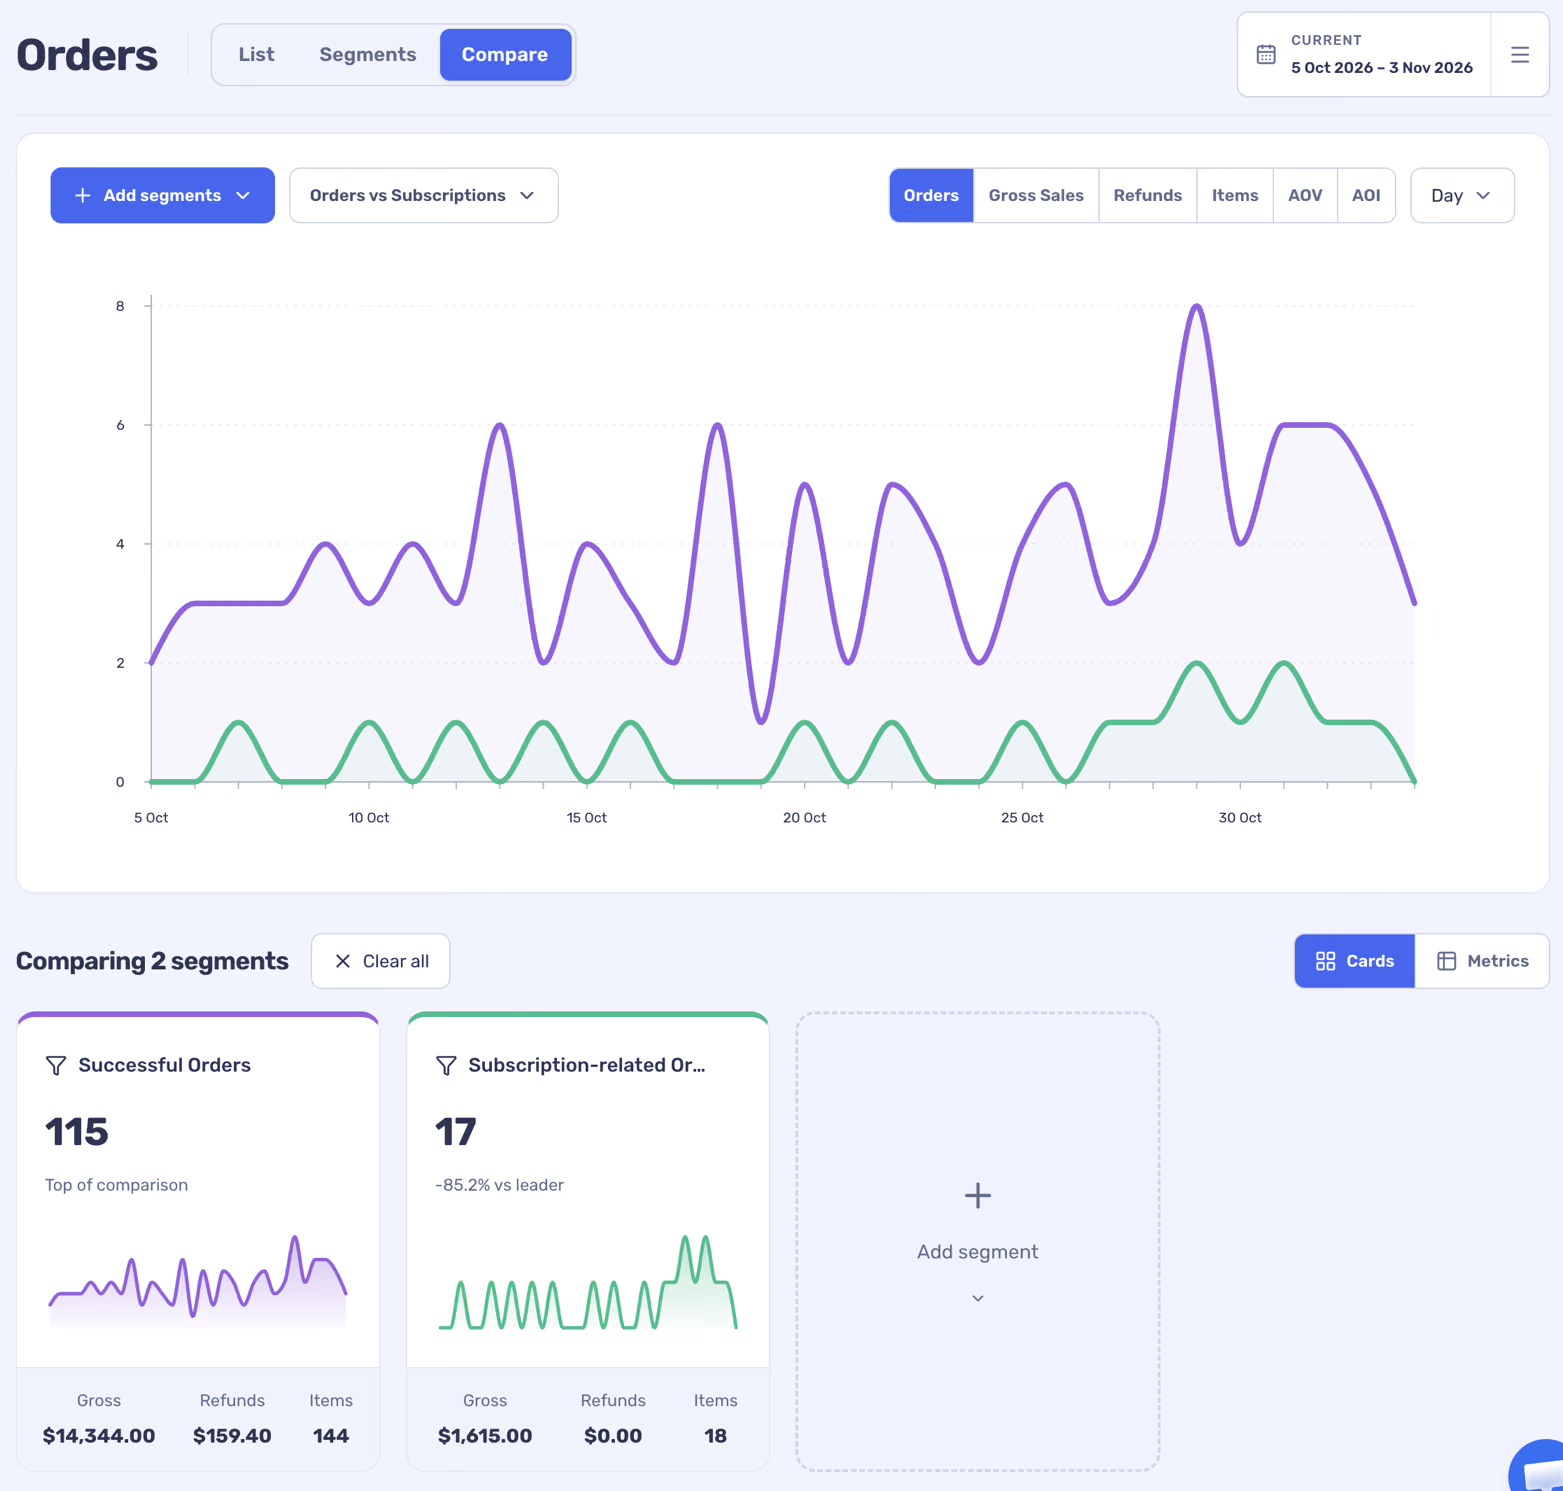
Compare views put several segments or products on the same chart so you can inspect their trends together.
4 min readChoose what to compare
Each series represents the selected segment or product. Read the explanation beneath the comparison for how that view counts and values its data.
- Open the Compare tab on Orders, Customers or Products.
- Select Add segments and choose the segments you want to compare; the product comparison also accepts products.
- Set the date range and select the metric and chart grouping.
Read and save the comparison
Use Cards for an individual summary and trend, or Metrics to see the measures in a table. Remove an item or add another to refine the view. Use the comparison menu to save a named comparison or reopen one saved in this browser.
Segments can overlap: the same order or customer can match more than one condition. Compare the patterns, but do not add overlapping results together as though they were separate populations.